


Summary: A Streptozotocin (STZ)-induced diabetic retinopathy rodent model mimicking human chronic DR.
Model Description
Diabetic retinopathy (DR) is the leading cause of preventable blindness in the world and the primary cause of vision loss among working-age adults. The pathology of DR ultimately results in diabetic macular edema (DME) and proliferative diabetic retinopathy (PDR). Up to 80% of diabetic patients will develop some form of retinopathy after 20 years of the disease onset.
To mimic a human DR condition in rodents, we use streptozotocin (STZ). STZ is a N-nitro derivative of glucosamine that is toxic to the insulin-producing pancreatic beta-cells. Administration of STZ induces chronic hyperglycemia. However, this model mimics only very early phase of diabetic retinopathy without prominent vascular changes in the retina.
The model is chronic with a typical follow-up time of 8-12 weeks. It is noteworthy to mention that animals start to develop cataracts approximately 8 weeks after the disease onset.
| Animal species | Mice, Rats |
| Method of induction | Injection of Streptozotocin |
| Follow-up period | Up to 12 weeks |
| Route of compound administration | Topical (e.g. eye drops), intravitreal injection, systemic |
| Read-outs | 1. In vivo imaging: – Fundoscopy; – Fluorescein angiography; – Optical coherence tomography (OCT); – Vitreofluorophotometry. 2. In vivo functional assessment 3. Morphological assessment 4. Molecular biology (ELISA, Western blotting, qPCR) |
Outcomes and Read-Outs
In vivo imaging
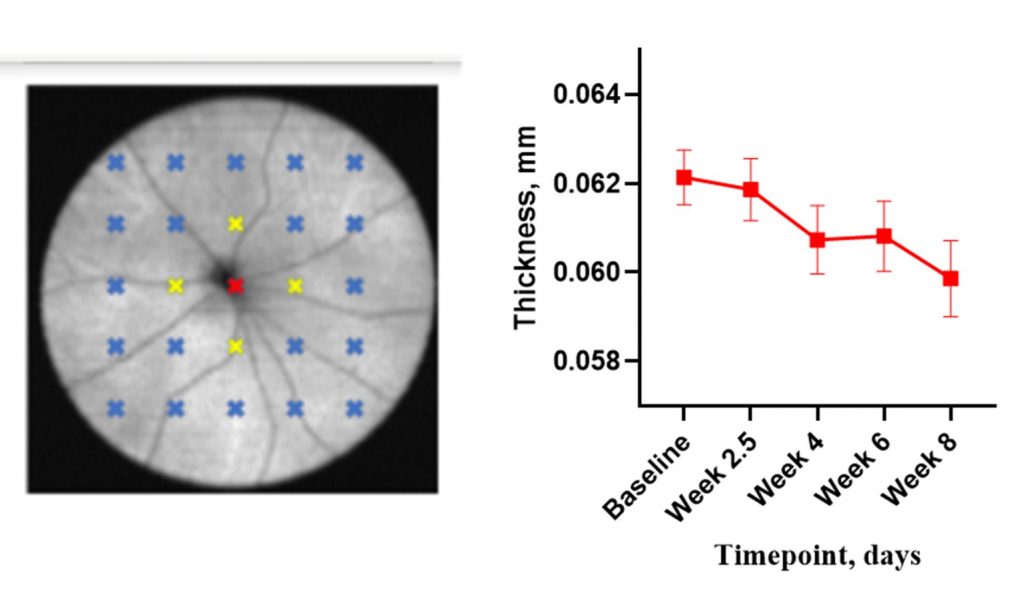
SD-OCT (Envisu R2210 and Envisu R2210, Bioptigen Inc./Leica Microsystems) retinal thickness imaging. A thinning of the inner retina can be monitored at different timepoints after the induction.
Functional assessment
Flash electroretinography (fERG) to assess function of outer retinas cells. A significant decrease in the a-wave and b-wave amplitude is seen at 8-weeks post-STZ induction even in mild hyperglycaemic cases.
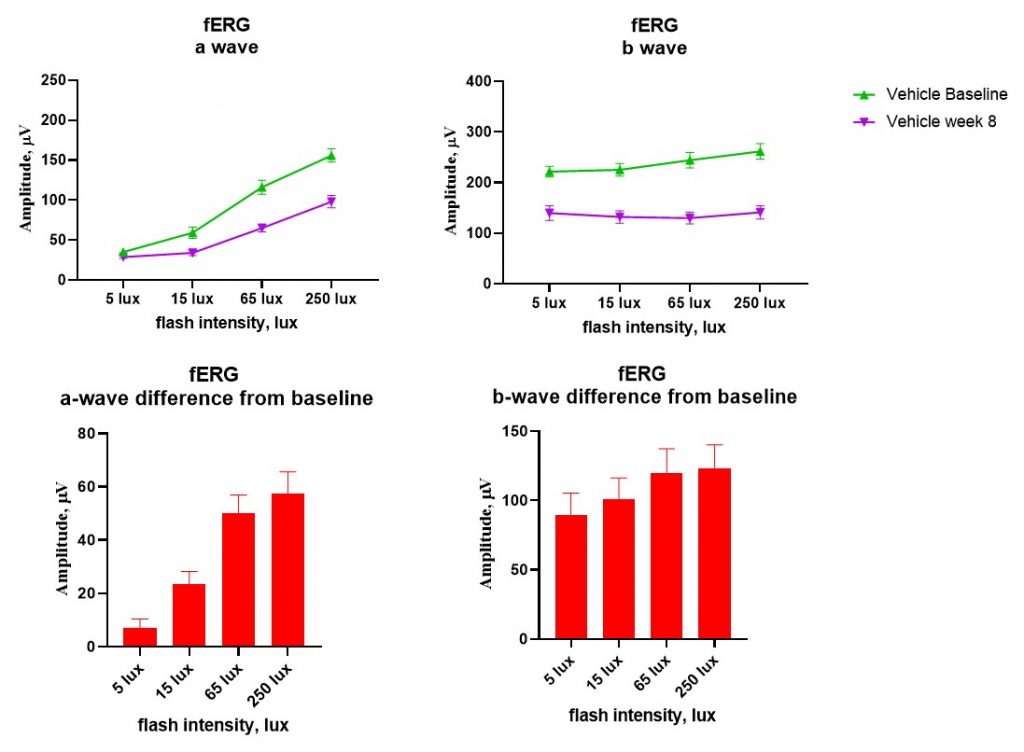
A representative example from the mild hyperglycemia group of mice.
Histology/morphometry
This model shows pericyte changes and microaneurysms that can typically be detected after 10 weeks post-STZ induction. However, the presence of cataract will make in vivo imaging at that timepoint challenging. Therefore, analysis should rely on histological read-out.
References
- Ragauskas S, Kielczewski E, Vance J, Kaja S, Kalesnykas G. In Vivo Multimodal Imaging and Analysis of Mouse Laser-Induced Choroidal Neovascularization Model. J Vis Exp (2018). PubMed PMID: 29443029
- Kinnunen K, Heinonen SE, Kalesnykas G, Laidinen S, Uusitalo-Järvinen H, Uusitalo H, Ylä-Herttuala S. LDLR-/-ApoB100/100 mice with insulin-like growth factor II overexpression reveal a novel form of retinopathy with photoreceptor atrophy and altered morphology of the retina. Mol Vis. (2013). 19:1723-33. PubMed PMID: 23922490
- Viita H, Kinnunen K, Eriksson E, Lähteenvuo J, Babu M, Kalesnykas G, Heikura T, Laidinen S, Takalo T, Ylä-Herttuala S. Intravitreal adenoviral 15-lipoxygenase-1 gene transfer prevents vascular endothelial growth factor A-induced neovascularization in rabbit eyes. Hum Gene Ther (2009).1679-86. PubMed PMID: 19694557.
- Kinnunen K, Kalesnykas G, Mähönen AJ, Laidinen S, Holma L, Heikura T, Airenne K, Uusitalo H, Ylä-Herttuala S. Baculovirus is an efficient vector for the transduction of the eye: comparison of baculovirus- and adenovirus-mediated intravitreal vascular endothelial growth factor D gene transfer in the rabbit eye. J Gene Med (2009). 11:382-9.
PubMed PMID: 19263462.