


Summary: NAION-like pathology induction leads to an acute ischemia and to edema, inflammation, and acute loss of retinal ganglion cells (RGCs) and optic nerve axons.
Model Description
Nonarteritic anterior ischemic optic neuropathy (NAION) is an acute ischemic stroke of the optic nerve leading to permanent and irreversible blindness (Berry et al., 2017). In rodents, NAION-like pathology can be induced by damaging the optic nerve head capillaries with an administration of photosensitive dye Rose Bengal and subsequent lasering (Guo et al., 2016). After the lasering, an acute ischemia leads to edema, inflammation and acute loss of retinal ganglion cells (RGCs) and optic nerve axons (Ragauskas et al., 2018).
The typical follow-up time is 2 weeks both in mice and in rats. The induction is unilateral leaving the contralateral eye as naive control.
| Animal species | Mice, Rats |
| Method of induction | Rose Bengal injection (iv) and lasering of optic nerve head area |
| Follow-up period | Typically 1-2 weeks |
| Route of compound administration | Topical (e.g. eye drops), intravitreal injections, systemic (iv, ip), subcutaneous |
| Read-outs | 1. In vivo imaging (fluorescein angiography, optical coherence tomography) 2. In vivo functional assessment: – Electroretinography 3. Morphological assessment: – Optic nerve axon counts (semi-thin optic nerve sections) – Routine histology (H&E staining for retinal sections) – Immunohistochemistry (typically RGC marker/glial marker and counterstain in retinal wholemounts), – Stereology of RGCs (retinal wholemounts) and optic nerve axons 4. Molecular biology (ELISA, Western blotting, qPCR) |
Outcomes and Read-Outs
In vivo imaging
Experimentica uses state-of-the-art in vivo imaging methodologies, which allow the longitudinal evaluation of pathological changes.
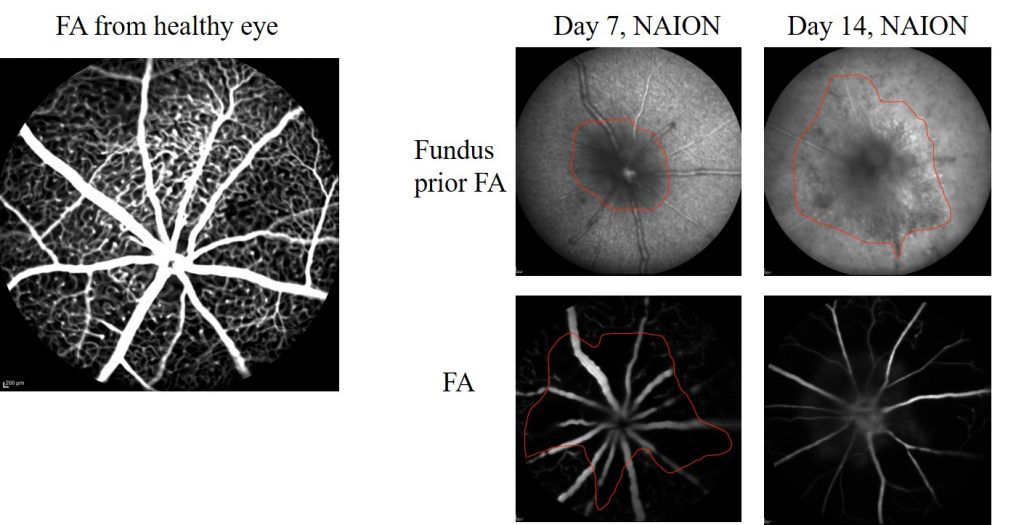
Fluorescein Angiography and fundus imaging are used to assess retinal ischemia at different timepoints after NAION induction (Heidelberg Spectralis, Heidelberg Engineering).
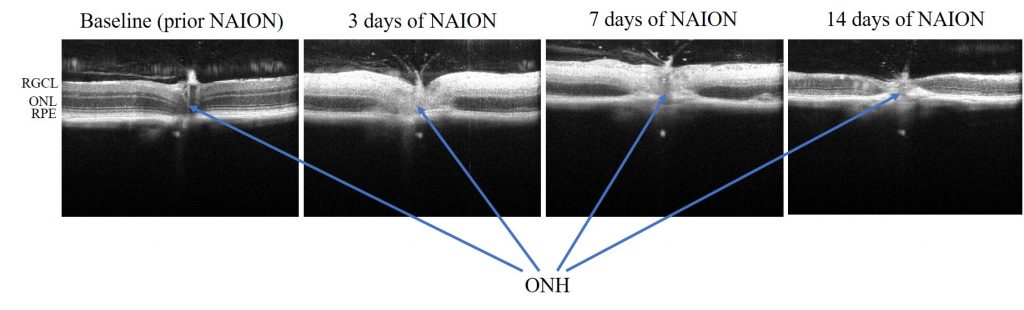
SD-OCT imaging provides cross-sectional view of optic nerve head and surrounding retinal tissue (Ragauskas et al., 2018). (Envisu R2210 and Envisu R2210 systems, Bioptigen Inc./Leica Microsystems)
Functional evaluation
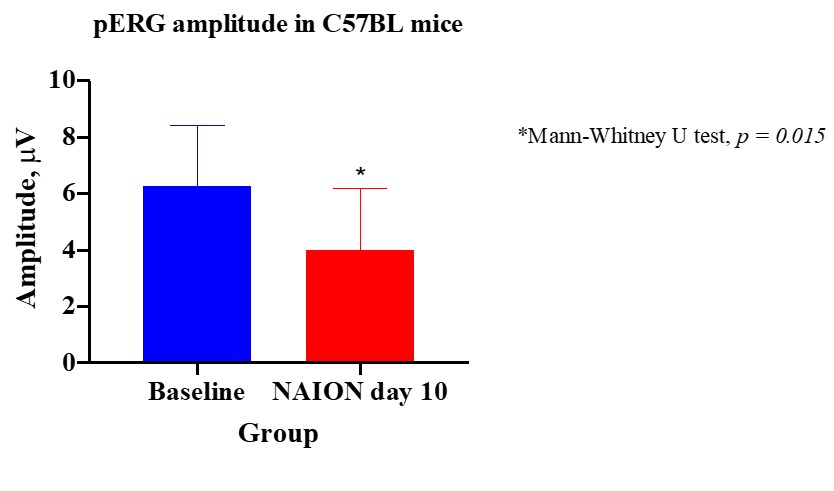
Induced ischemia causes the loss of retinal ganglion cells (RGCs). RGCs’ function can be quantitatively measured using pattern electroretinography (pERG).
Histology/morphometry
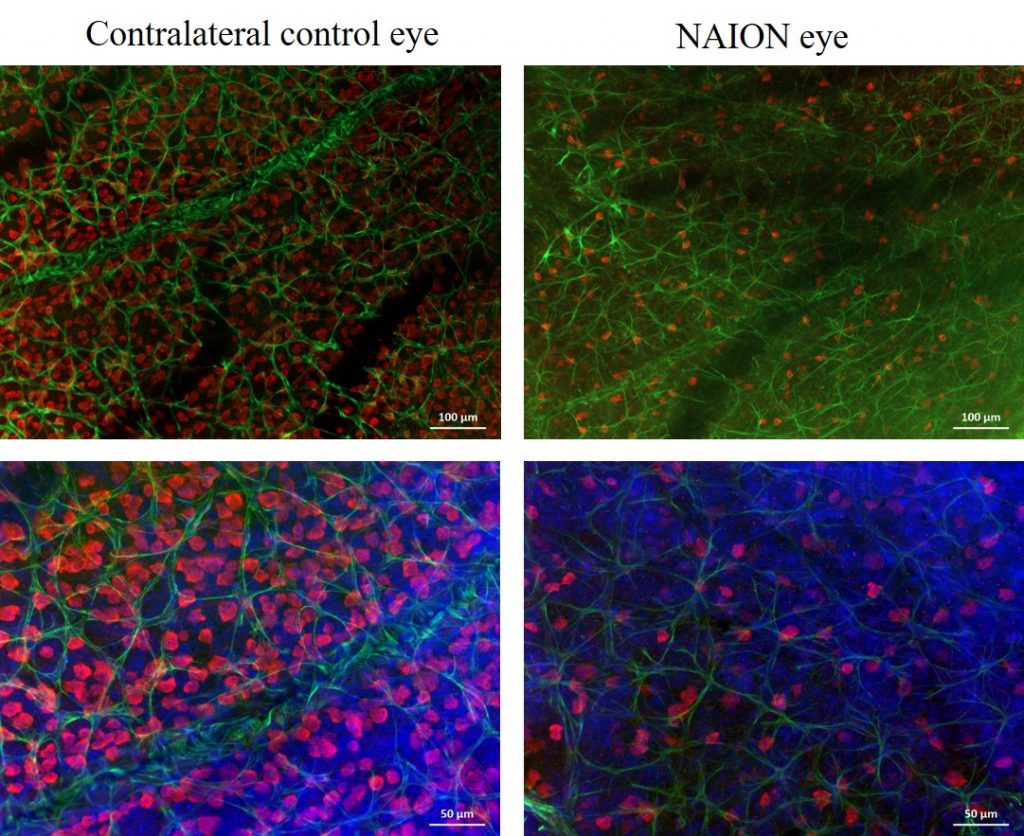
Immunohistochemical labeling of RGCs and their quantification can be performed in retinal flatmounts or from serially sectioned eyes.
References
- Ragauskas S, Ziniauskaite A, Kaja S, Kalesnykas G. Neuroprotection of retinal ganglion cells via NMDA-dependent mechanism in the mouse non-arteritic anterior ischemic optic neuropathy (NAION) model. Poster presentation at ARVO 2018.
- Berry S, Lin WV, Sadaka A, Lee AG. Nonarteritic anterior ischemic optic neuropathy: cause, effect, and management. Eye Brain. 2017 Sep 27;9:23-28. doi: 10.2147/EB.S125311. eCollection 2017. Review. PubMed PMID: 29033621.
- Guo Y, Mehrabian Z, Bernstein SL. The Rodent Model of Nonarteritic Anterior Ischemic Optic Neuropathy (rNAION). J Vis Exp. 2016 Nov 20;(117). doi: 10.3791/54504.