


Summary: Oxygen-induced retinopathy model mimics retinopathy of prematurity and human ischemic retinopathies.

Abstract
Background
Oxygen-induced retinopathy model mimics retinopathy of prematurity and human ischemic retinopathies. Retinopathy of prematurity (ROP) affects premature infants that weigh less than 1,250 grams or that are born before 31 weeks of gestation. ROP is a potentially blinding eye disorder. As advances in care for premature neonates have reduced the impact of ROP, a significant number of infants will require treatment for severe ROP. About 400-600 infants each year in the US become legally blind from ROP [1].
ROP progresses in two phases. In Phase I, a delay in retinal vascular development with modest vaso-obliteration is observed [2]. The subsequent vascular repair phase (Phase II) is characterized by pathological neovascularization [2].
Retinal angiogenesis in rodents occurs postnatally, providing a model system to study the development and growth of the retinal vasculature. Newborn mice, for example, have an almost avascular retina that develops after birth until full vascular maturation is achieved around postnatal day (P) P21–P25 [3].
Two rodent models, mouse and rat, are commonly used to study the pathophysiology of ROP and to test the preclinical efficacy of drug candidates for ROP. The two models differ in their mode of induction (chronic hyperoxia in mice versus alternating hyperoxia/hypoxia in rats; see details below) and in the manifestation of their vascular phenotypes. In mice, vaso-obliteration occurs primarily in the central retina. In contrast, vaso-obliteration is more peripheral in the rat oxygen-induced retinopathy model and in human ROP [3].
There are various considerations for the choice of the mouse versus the rat oxygen-induced retinopathy model. While the rat model more accurately mimics human ROP, the mouse model offers a robust, fast and reproducible means to induce phenotypes of vaso-obliteration and neovascularization. Furthermore, the mouse oxygen-induced retinopathy model is amenable to genetic manipulation by providing a platform for testing transgenic animals.
Notably, the ability to study vasculature development in the central retina makes the mouse oxygen-induced retinopathy model an attractive preclinical model to conduct pharmacologic efficacy studies for a number of ischemic retinopathies and ocular neovascular conditions, including proliferative diabetic retinopathy, retinal vein occlusion, and exudative age-related macular degeneration.

Study designs for the mouse and rat oxygen-induced retinopathy models
At Experimentica we have fully implemented and validated both the mouse and the rat oxygen-induced retinopathy model. Our protocols follow the standard protocols in the field [3, 4], summarized in Figure 2.
In the rat oxygen-induced retinopathy model, newborn rats are exposed to an alternating protocol of 50% oxygen (hyperoxia) and 10% oxygen (hypoxia), cycling every 24 h between birth (postnatal day 0, P0) and postnatal day 14 (P14).
In contrast, mice (postnatal day 7) are exposed to chronic hyperoxia (75% O2) for 5 days and subsequently returned to normoxic conditions and sacrificed at P17, as originally described [5].

As part of the rigor and standardization, oxygen levels are set and controlled using O2 controller (BioSpherix ProOx, Model P110 and P360, Biospherix Ltd., NY, USA).
Test compound/treatment administration
In most studies, treatments are administered at postnatal day 14 (P14). At Experimentica, our scientists are specialized in ocular drug administration and routinely perform intravitreal injections in mouse and rat pups. Of course, test compounds can also be administered by topical or systemic route.
Important strain considerations
The formation of oxygen-induced retinopathy-related pathology is strain- and vendor specific. For example, albino BALB/c mice retinas do not develop NV at all [6]. Thus, pigmented C57BL/6J mice are widely used for the mouse oxygen-induced retinopathy model. In rats, pigmented Brown Norway rats produce more severe pathology compared to Sprague Dawley (SD) rats. SD rats are still commonly used, however, there have been reported vendor-related differences in the oxygen-induced retinopathy-related pathology [7, 8]. SD rats from Charles River produce twice as much neovascularization as compared to rats from Harlan or Zivic-Miller [9].
Oxygen-induced retinopathy model readouts at Experimentica
Evaluation of the vasculature from retinal flat mounts
Following euthanasia, the eyes are dissected and retinal flat mounts are prepared and stained for Isolectin B4 for vascular evaluation: avascular areas (AVAs) and areas of neovascularization (NV) are quantified.
In the rat oxygen-induced retinopathy model the amount of neovascularization reaches its maximum around P18-P20 and subsequently starts to regress. The extent of AVAs and area of NV at three different time points in rat oxygen-induced retinopathy is presented in Figure 3.


Microglia activation
The total number of microglia can be estimated from retinal flat mounts stained for the microglial marker, Iba1. At Experimentica, we use stereology to provide a standardized and bias-free quantification.
In vivo imaging: fluorescein angiography and spectral domain optical coherence tomography
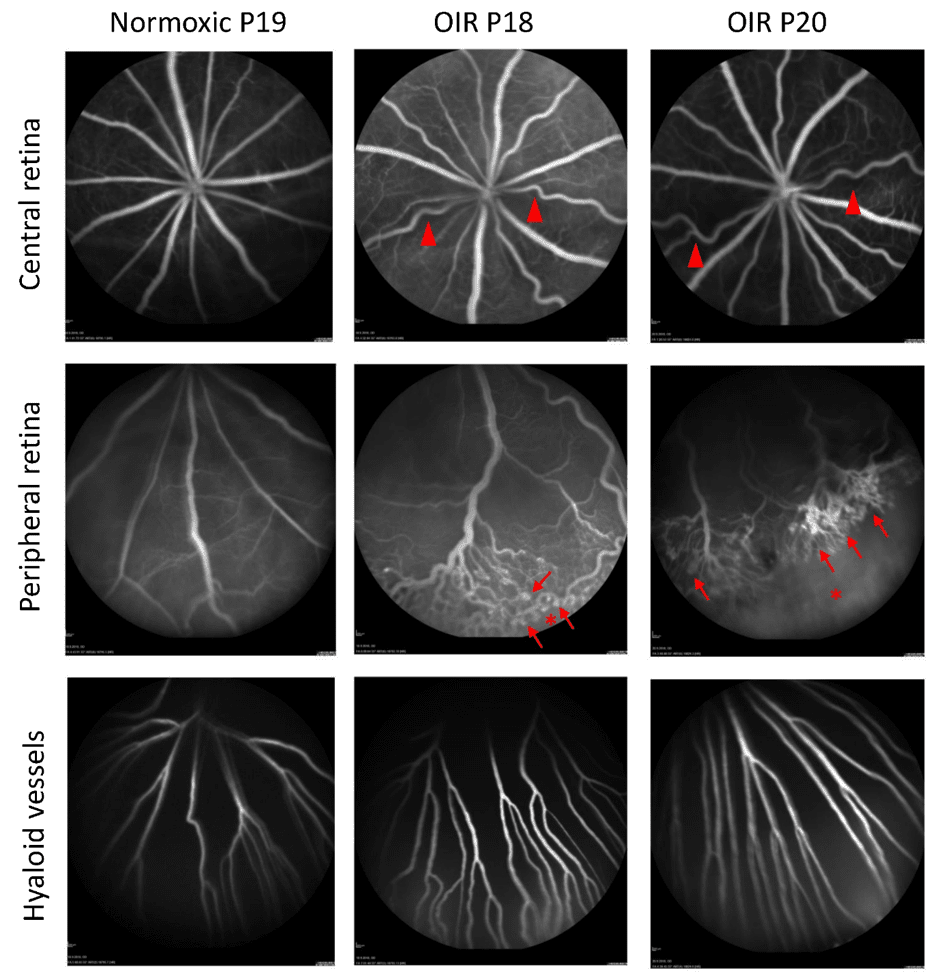
At Experimentica, we specialized in the longitudinal in vivo imaging of the eye and have validated the use of fluorescein angiography (FA) and spectral-domain optical coherence tomography (SD-OCT) in the rat oxygen-induced retinopathy model. Using a Heidelberg Spectralis FA system and a Leica Microsystems/ Bioptigen Envisu SD-OCTs, we can achieve industry-leading resolution to quantify subtle changes in the disease pathology (Figures 4-5).

Electroretinogram for evaluating neuronal function
Flash electroretinogram (fERG) can be used to measure the electrical activity generated by the neural and non-neural cells in the retina in response to a light stimulus and serve as a functional readout to determine the effect oxygen-induced retinopathy causes on retinal neuron function (Figure 6).

References
- Bashinsky, A.L., Retinopathy of Prematurity. N C Med J, 2017. 78(2): p. 124-128.
- Hartnett, M.E., Pathophysiology and mechanisms of severe retinopathy of prematurity. Ophthalmology, 2015. 122(1): p. 200-10.
- Kim, C.B., P.A. D’Amore, and K.M. Connor, Revisiting the mouse model of oxygen-induced retinopathy. Eye Brain, 2016. 8: p. 67-79.
- Penn, J.S., M.M. Henry, and B.L. Tolman, Exposure to alternating hypoxia and hyperoxia causes severe proliferative retinopathy in the newborn rat. Pediatr Res, 1994. 36(6): p. 724-31.
- Smith, L.E., et al., Oxygen-induced retinopathy in the mouse. Invest Ophthalmol Vis Sci, 1994. 35(1): p. 101-11.
- Ritter, M.R., et al., Myeloid progenitors differentiate into microglia and promote vascular repair in a model of ischemic retinopathy. J Clin Invest, 2006. 116(12): p. 3266-76.
- Floyd, B.N., et al., Differences between rat strains in models of retinopathy of prematurity. Mol Vis, 2005. 11: p. 524-30.
- Dorfman, A.L., et al., Functional and structural changes resulting from strain differences in the rat model of oxygen-induced retinopathy. Invest Ophthalmol Vis Sci, 2009. 50(5): p. 2436-50.
- Barnett, J.M., S.E. Yanni, and J.S. Penn, The development of the rat model of retinopathy of prematurity. Doc Ophthalmol, 2010. 120(1): p. 3-12.