Disease models
Laser-Induced Choroidal Neovascularization
In 1989, Dobi and colleagues were first to describe a rat Choroidal Neovascularization model (CNV), which was induced using a krypton laser. Rapid development of different in vivo imaging modalities turned this model into a powerful and validated tool for the screening of novel drug candidates with anti-angiogenic and/or anti-fibrotic properties. This model mimics multiple pathological features of exudative age-related macular degeneration (AMD).
Technical details
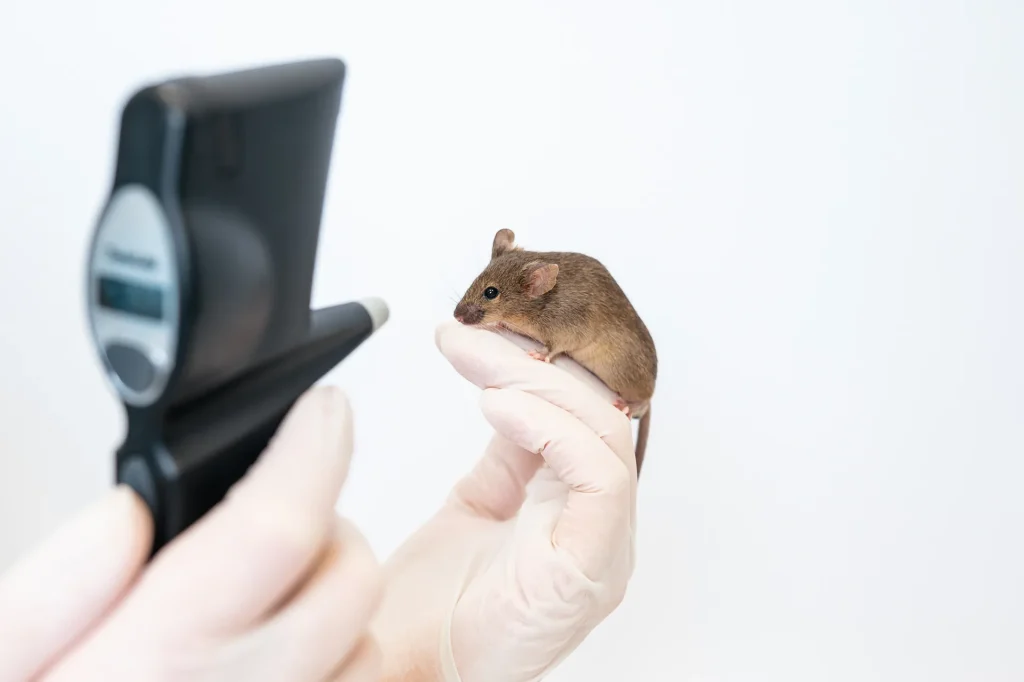
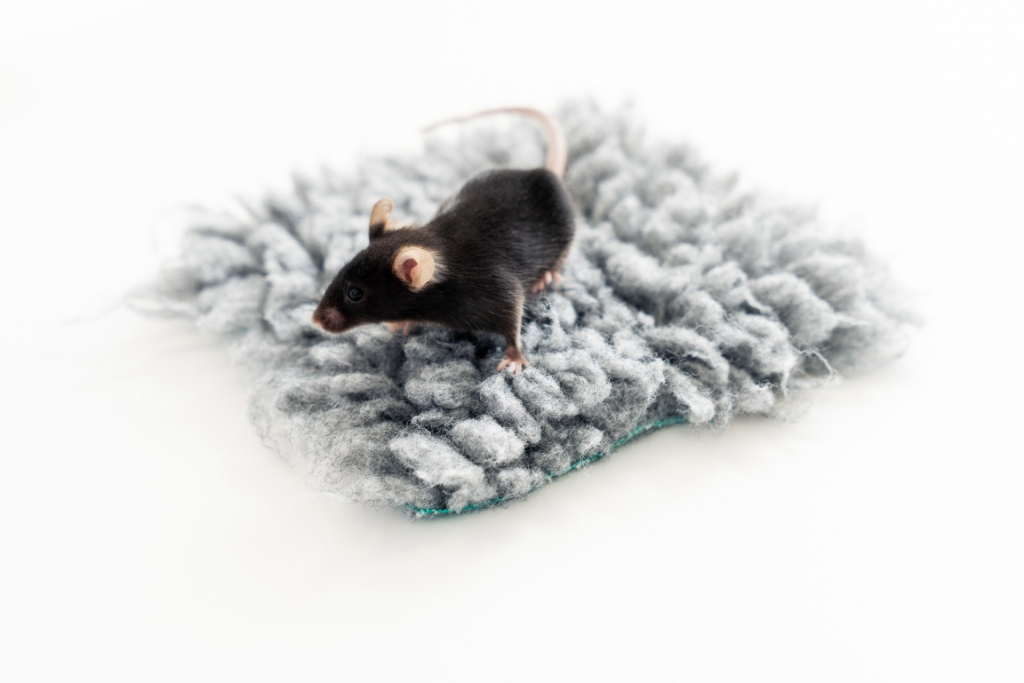
Mouse and rat
Lasering
Typically 7 – 14 days
– A qualitative grade of retinal leakage (FA and SD-OCT)
– An area of retinal leakage (FA)
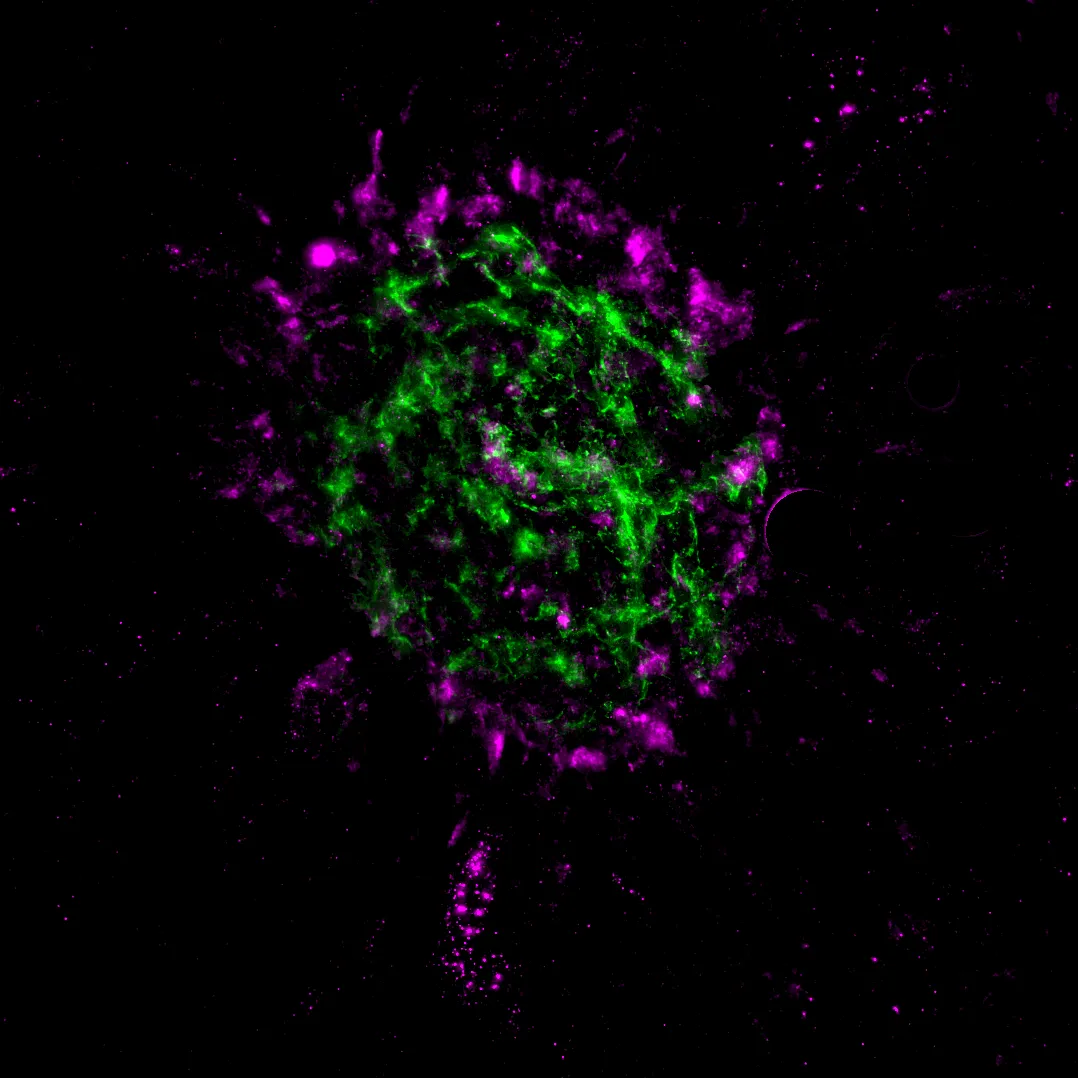
– An area of isolectin B4 staining from choroidal flat mounts
Scientific excellence in every model
Anti-angiogenic drug screening
A quick screening of anti-angiogenic properties of your test article
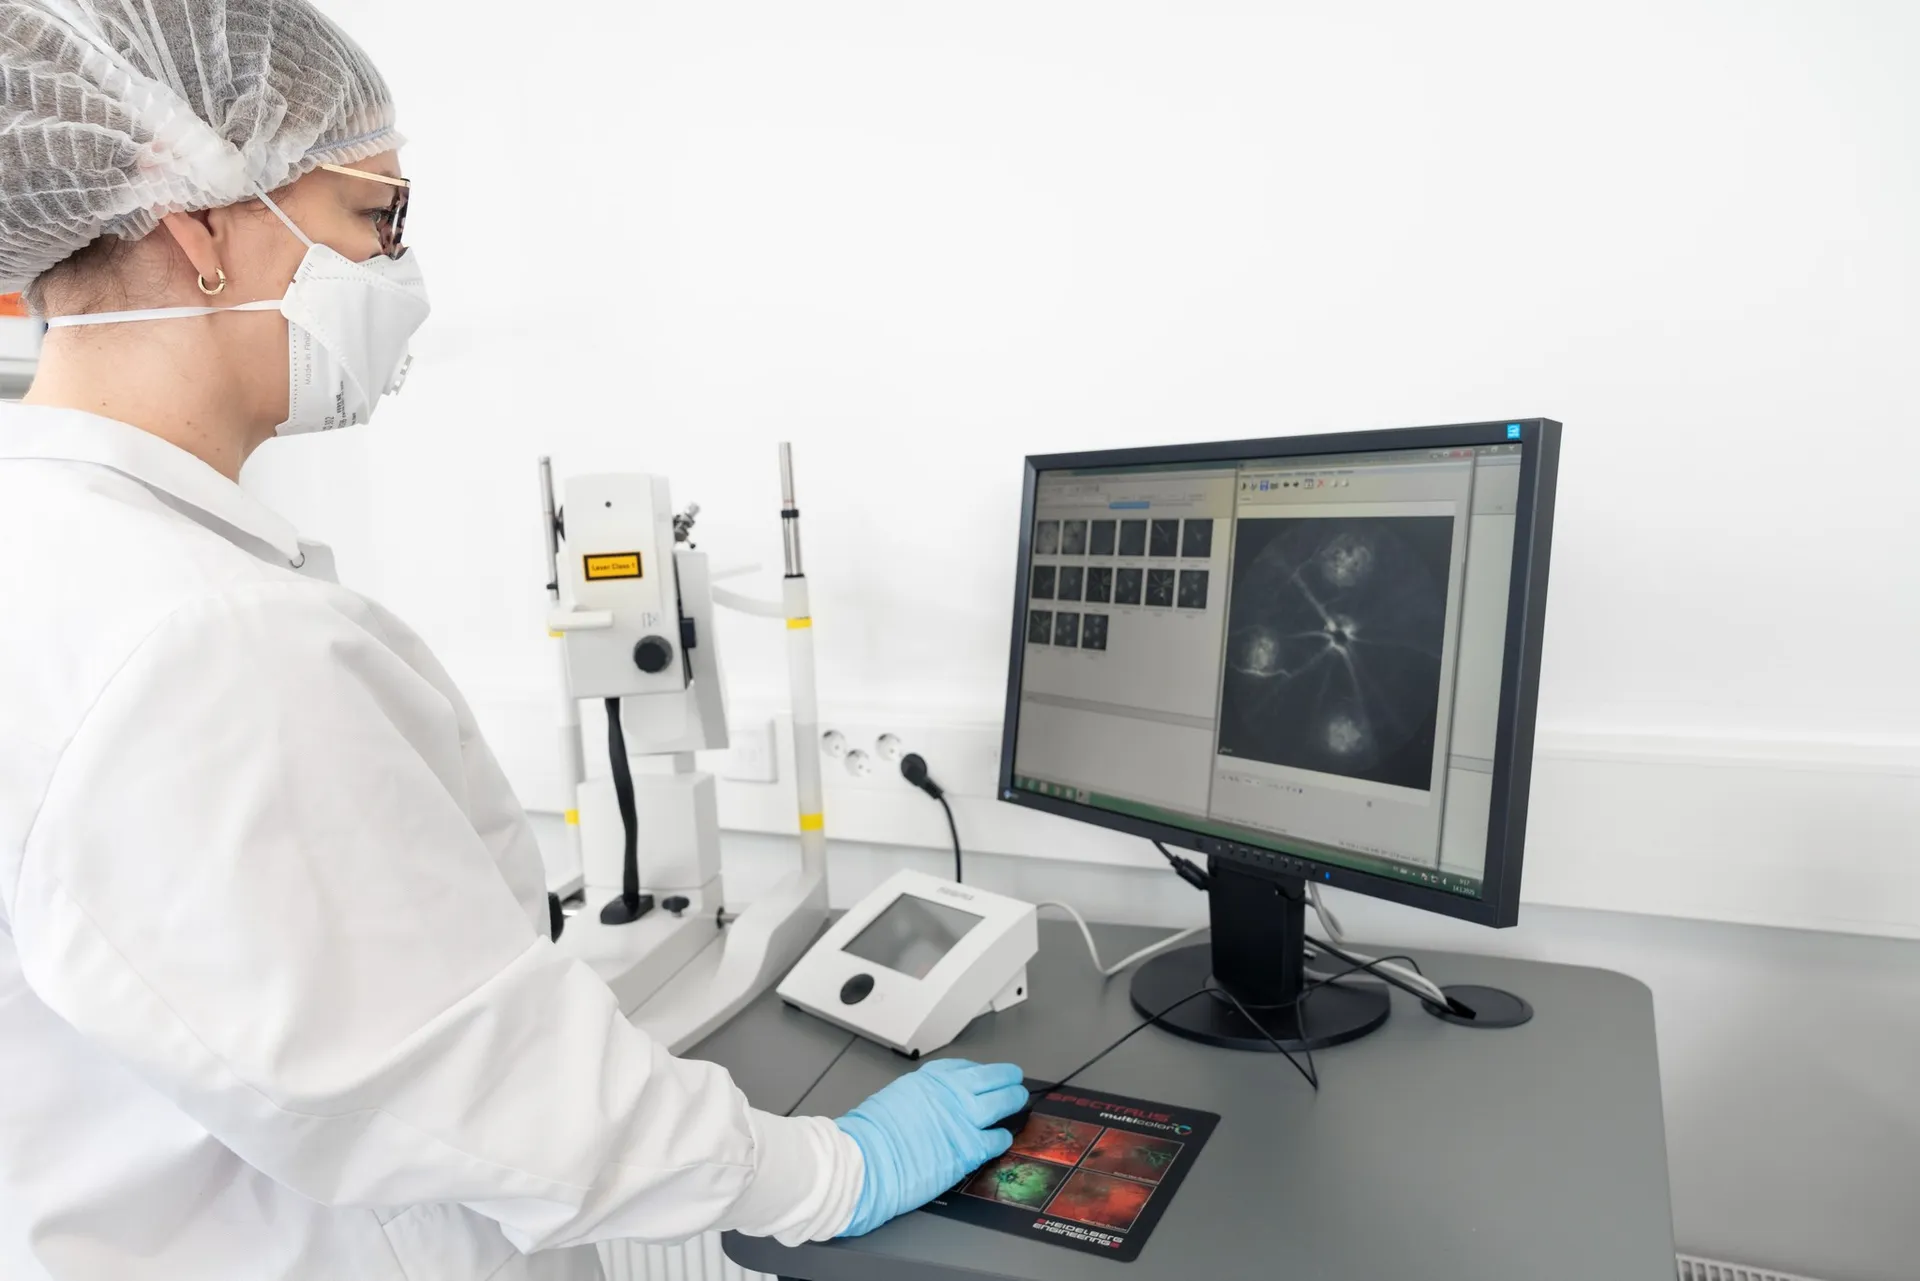
Advanced imaging capabilities
Multiple in vivo imaging timepoints for efficacy detection using our latest state-of-the-art equipment
Unbiased AI-powered analysis
Unbiased data analysis using our proprietary AI-driven algorithms
References
- Dobi ET, Puliafito CA, Destro M. A New Model of Experimental Choroidal Neovascularization in the Rat. Arch Ophthalmol. 1989;107(2):264–269. doi:10.1001/archopht.1989.01070010270035
- Ragauskas S, Kielczewski E, Vance J, Kaja S, Kalesnykas G. In Vivo Multimodal Imaging and Analysis of Mouse Laser-Induced Choroidal Neovascularization Model. J Vis Exp. 2018 Jan 21;(131):56173. doi: 10.3791/56173
We are here to help
Whether you have a question about our preclinical models, capabilities, pricing or anything else, our team is ready to answer all your inquiries.
Related services
AI for image analysis
AI-driven image analysis for in vivo studies, delivering faster, unbiased results and deeper insights for your preclinical ocular programs.
Learn moreHistological staining
Histological staining techniques for ocular and nervous system tissues to support detailed analysis.
Learn moreImmunohistochemistry
Experimentica offers a wide range of single and multiplex immunofluorescence labeling to explore disease pathogenesis and therapeutic targets.
Learn moreWestern Blotting
Western blot detects protein expression and modifications in ocular tissues with high sensitivity and precision
Learn moreELISA
ELISA enables sensitive protein detection and quantification in ocular tissues and biofluids.
Learn moreRT-qPCR
qPCR measures gene expression in ocular tissues, supporting disease research and treatment evaluation.
Learn moreCheck out our latest news and activities
All News
Experimentica Appoints Dr. Artem Shatillo as Director, Digital Transformation
FELASA 2025 presentation: Assessing lidocaine-based analgesia for mouse ear notching: Insights into strain-specific reactions
Experimentica presents at FELASA 2025