In vivo models
Optic Nerve Crush
The optic nerve crush (ONC) model was first introduced by Li and his colleagues in the late nineties (Li et al., 1999) and has since become a widely used approach for studying neural degeneration. This model involves mechanically crushing the optic nerve behind the eye globe, leading to axonal degeneration and subsequent retinal ganglion cell (RGC) apoptosis, mimicking glaucomatous neuropathy. As a result, RGC death impairs signal transmission to the visual cortex, ultimately causing functional deficits and vision loss.
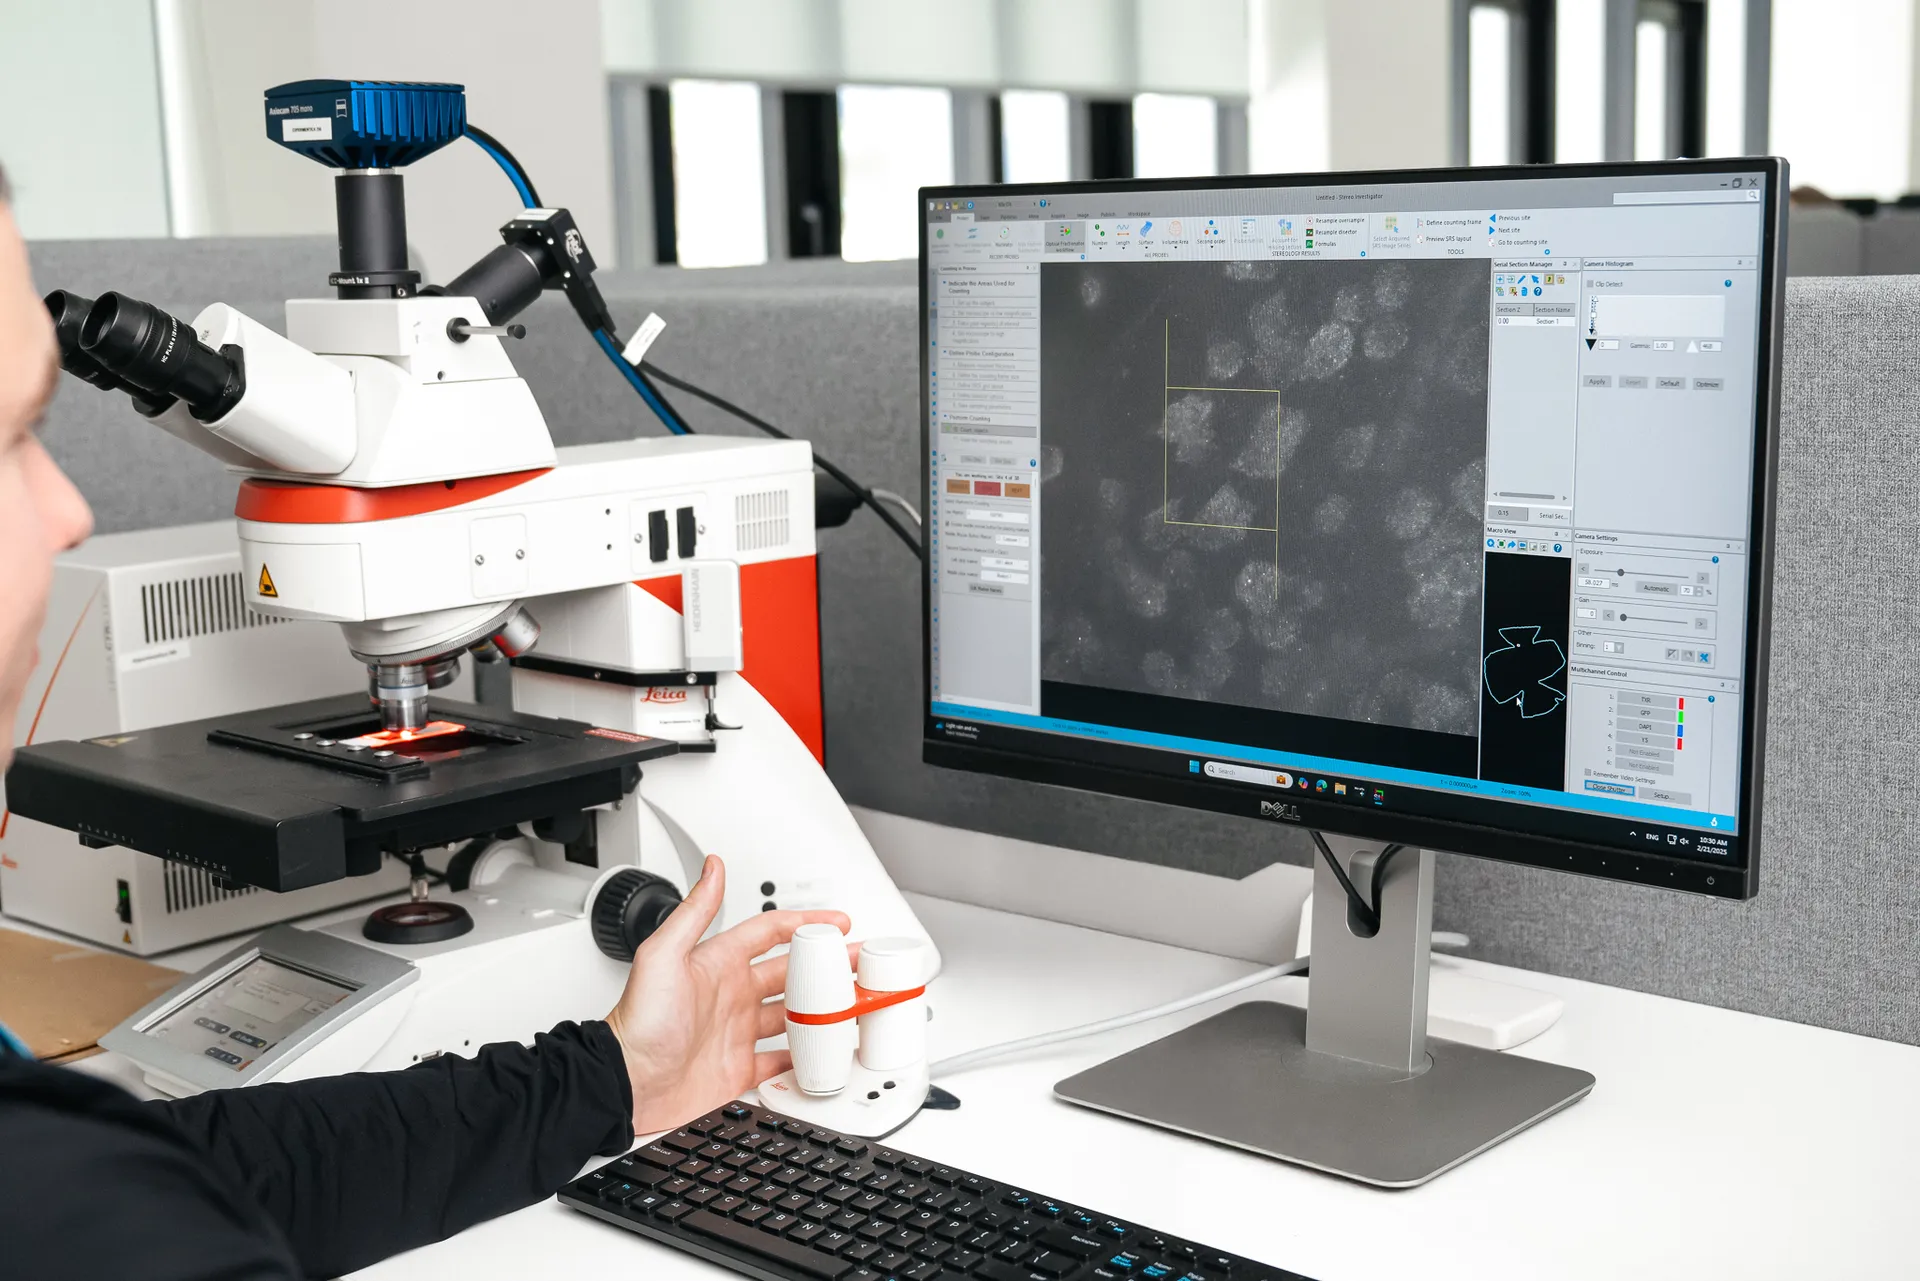
At Experimentica, we have fully implemented and validated both mouse and rat ONC models (Kalesnykas et al., 2012; Leinonen et al., 2016; Maciulaitiene et al., 2017). Our capabilities include non-invasive in vivo imaging techniques such as spectral-domain optical coherence tomography (SD-OCT) to monitor structural changes in the retina. We also offer functional assessments, including pattern electroretinography (pERG), visual evoked potential (VEP), and optomotor reflex (OMR), to evaluate visual function. Additionally, we provide immunostaining and unbiased quantification of RGCs, as well as optic nerve damage evaluation.
Technical details
Glaucoma
Mouse and rat
Crushing the eye optic nerve with self-closing forceps for a standard duration of three (3) seconds (the duration can be adjusted depending on the desired severity of the injury)
Topical, intravitreal injection, intracameral injection, subretinal, systemic
In vivo imaging:
– Doppler imaging to verify the blood circulation gets normal within the first 2-3 min. after the crush
– SD-OCT imaging to quantitatively assess individual retinal layer thickness
Visual function assessment:
– pERG to assess retinal ganglion cell function
– VEP recordings from primary visual cortex
Behavioral vision assessment:
– OMR testing, including visual acuity and contrast sensitivity
Histology and immunohistochemistry:
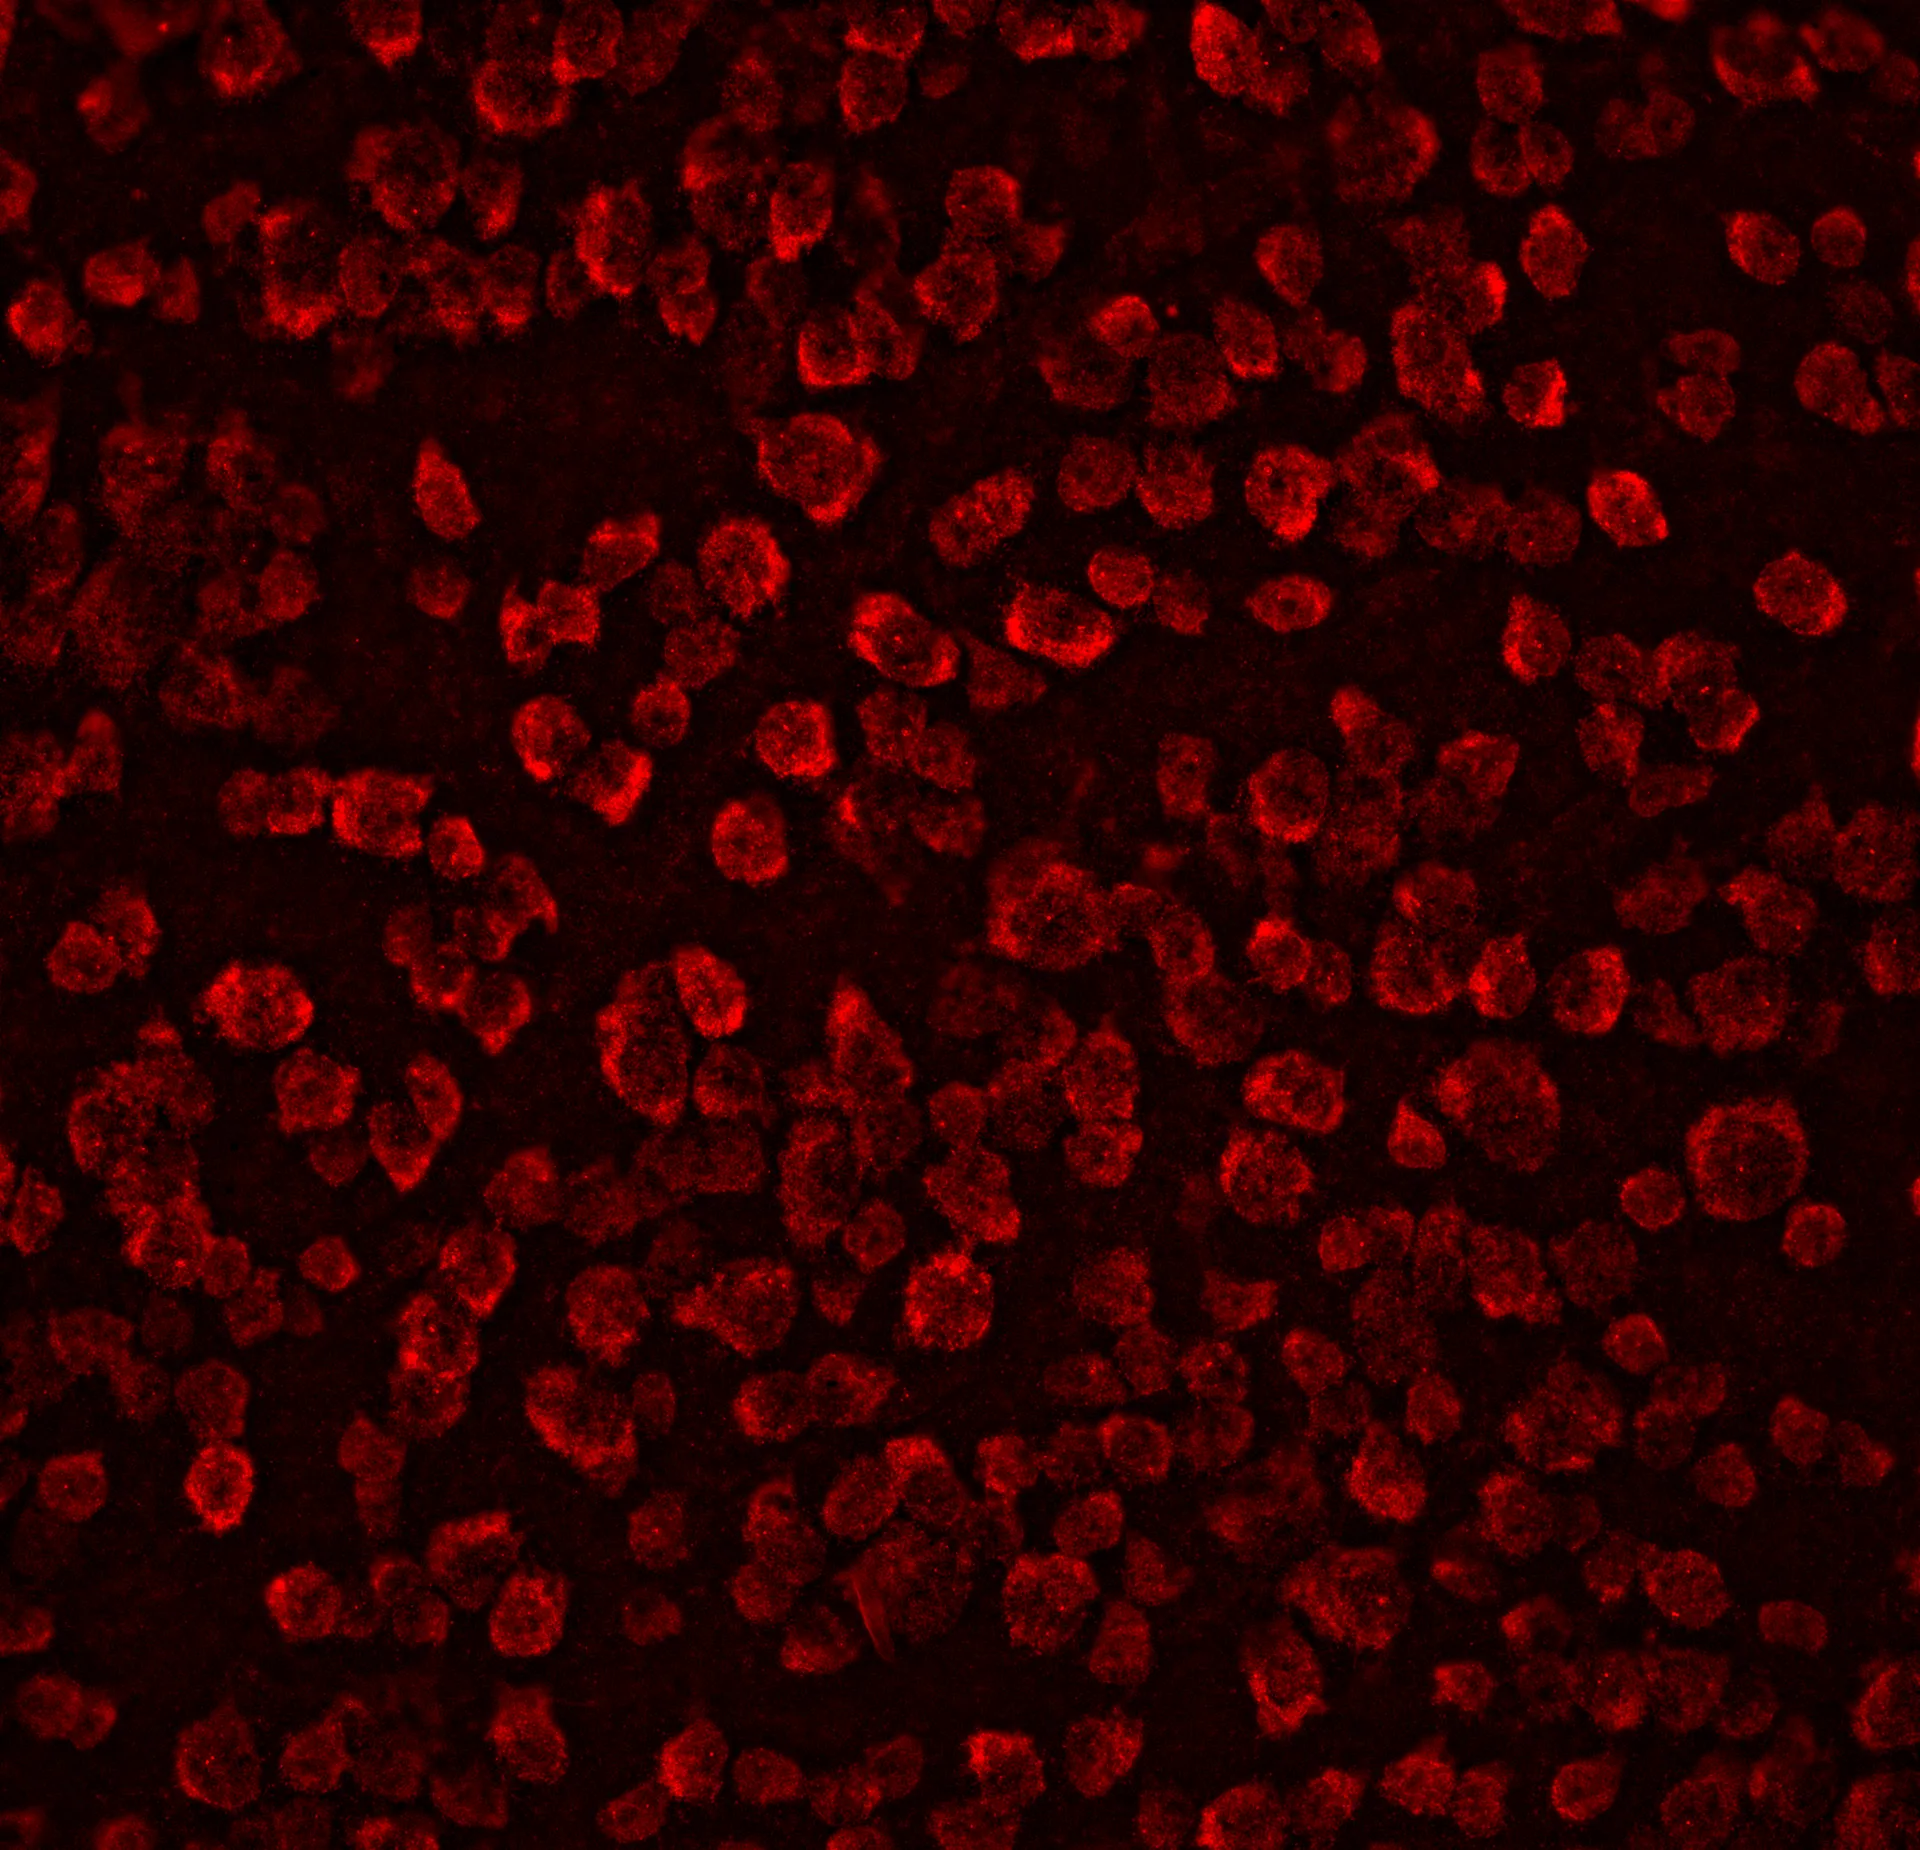
– Quantitative analysis of retinal ganglion cells loss
– Qualitative assessment of optic nerve damage
Molecular biology:
– ELISA
– Western blot
– qPCR
Highlights of this model
Scientific relevance
The ONC model effectively mimics glaucomatous neuropathy, making it ideal for testing neuroprotective compounds
Cutting-edge technology
Our capabilities allow for non-invasive in vivo imaging and functional testing, reducing the need for invasive endpoints
Unbiased data
AI-driven analysis of retinal thickness measurements and retinal ganglion cell estimation using stereology ensures unbiased evaluations of neuroprotective treatments
References
- Li Y, Schlamp CL, Nickells RW. Experimental induction of retinal ganglion cell death in adult mice. Investigative ophthalmology & visual science. 1999 Apr 1;40(5):1004-8.
- Kalesnykas G, Oglesby EN, Zack DJ, Cone FE, Steinhart MR, Tian J, Pease ME, Quigley HA. Retinal ganglion cell morphology after optic nerve crush and experimental glaucoma. Investigative ophthalmology & visual science. 2012 Jun 1;53(7):3847-57.
- Leinonen HO, Ragauskas S, Tanila H, Kalesnykas G. Simultaneous pattern ERG-VEP recording after optic nerve crush in albino rats. Investigative Ophthalmology & Visual Science. 2016 Sep 26;57(12):5763-.
- Maciulaitiene R, Ragauskas S, Pakuliene G, Kaja S, Januleviciene I, Kalesnykas G. Assessment of the effects of systemically administered levetiracetam in an ocular model for neuroprotection. Investigative Ophthalmology & Visual Science. 2017 Jun 23;58(8):2571-.
Receive model details
Interested to learn more? Fill out the form below and we will email you a white paper on the disease model. Your information will not be added to any mailing lists or used for marketing purposes.
"*" indicates required fields
We are here to help
Whether you have a question about our preclinical models, capabilities, pricing or anything else, our team is ready to answer all your inquiries.
Related services
Visual Evoked Potentials
Visual evoked potential recording is used to assess visual pathway function from retina to cortex in models of glaucoma and optic neuropathies.
Learn moreOptomotor Reflex
Experimentica offers behavioral assessment and optomotor response testing to evaluate visual acuity and contrast sensitivity in rodent models.
Learn moreAI for image analysis
AI-driven image analysis for in vivo studies, delivering faster, unbiased results and deeper insights for your preclinical ocular programs.
Learn moreCheck out our latest news and activities
All News