Disease models
Oxygen-Induced Retinopathy
In 1994, Smith and colleagues described a robust and reproducible mouse hyperoxia model of proliferative retinal neovascularization to mimic retinal angiopathies. In 1994, Penn et al. introduced a model that produced retinopathy of prematurity (ROP)-like pathology in rats, using alternating hypoxia and hyperoxia.
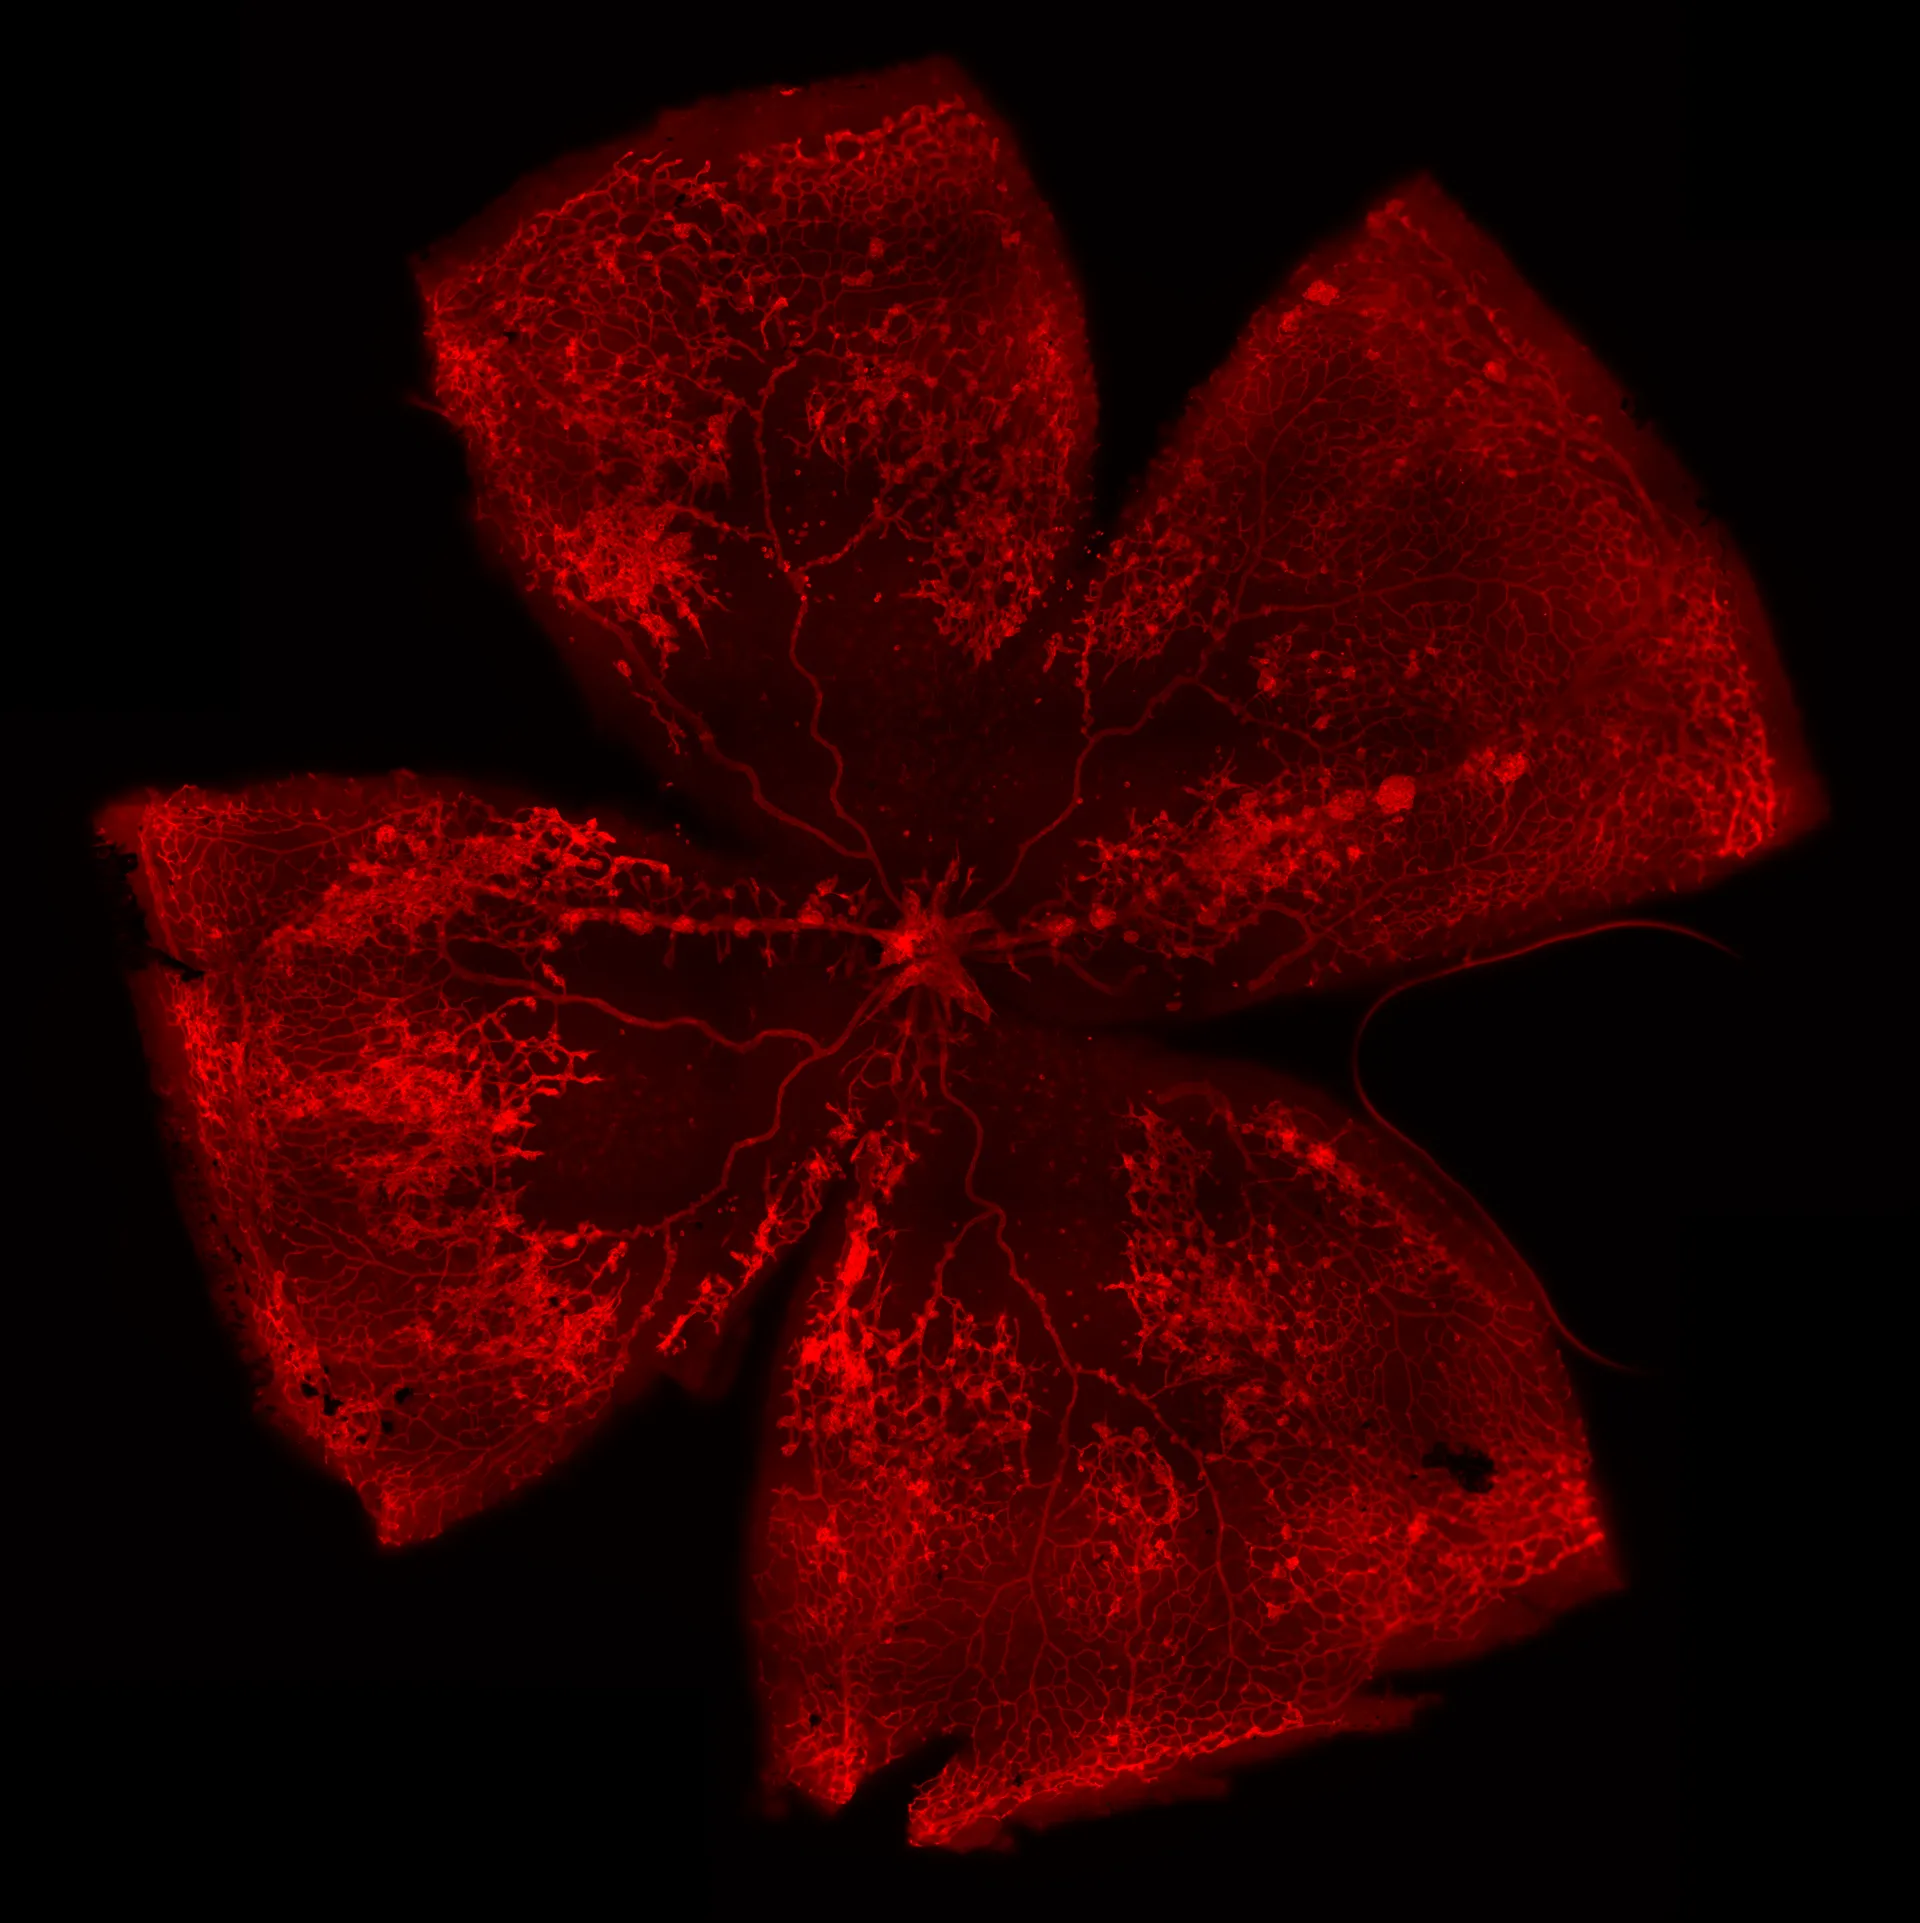
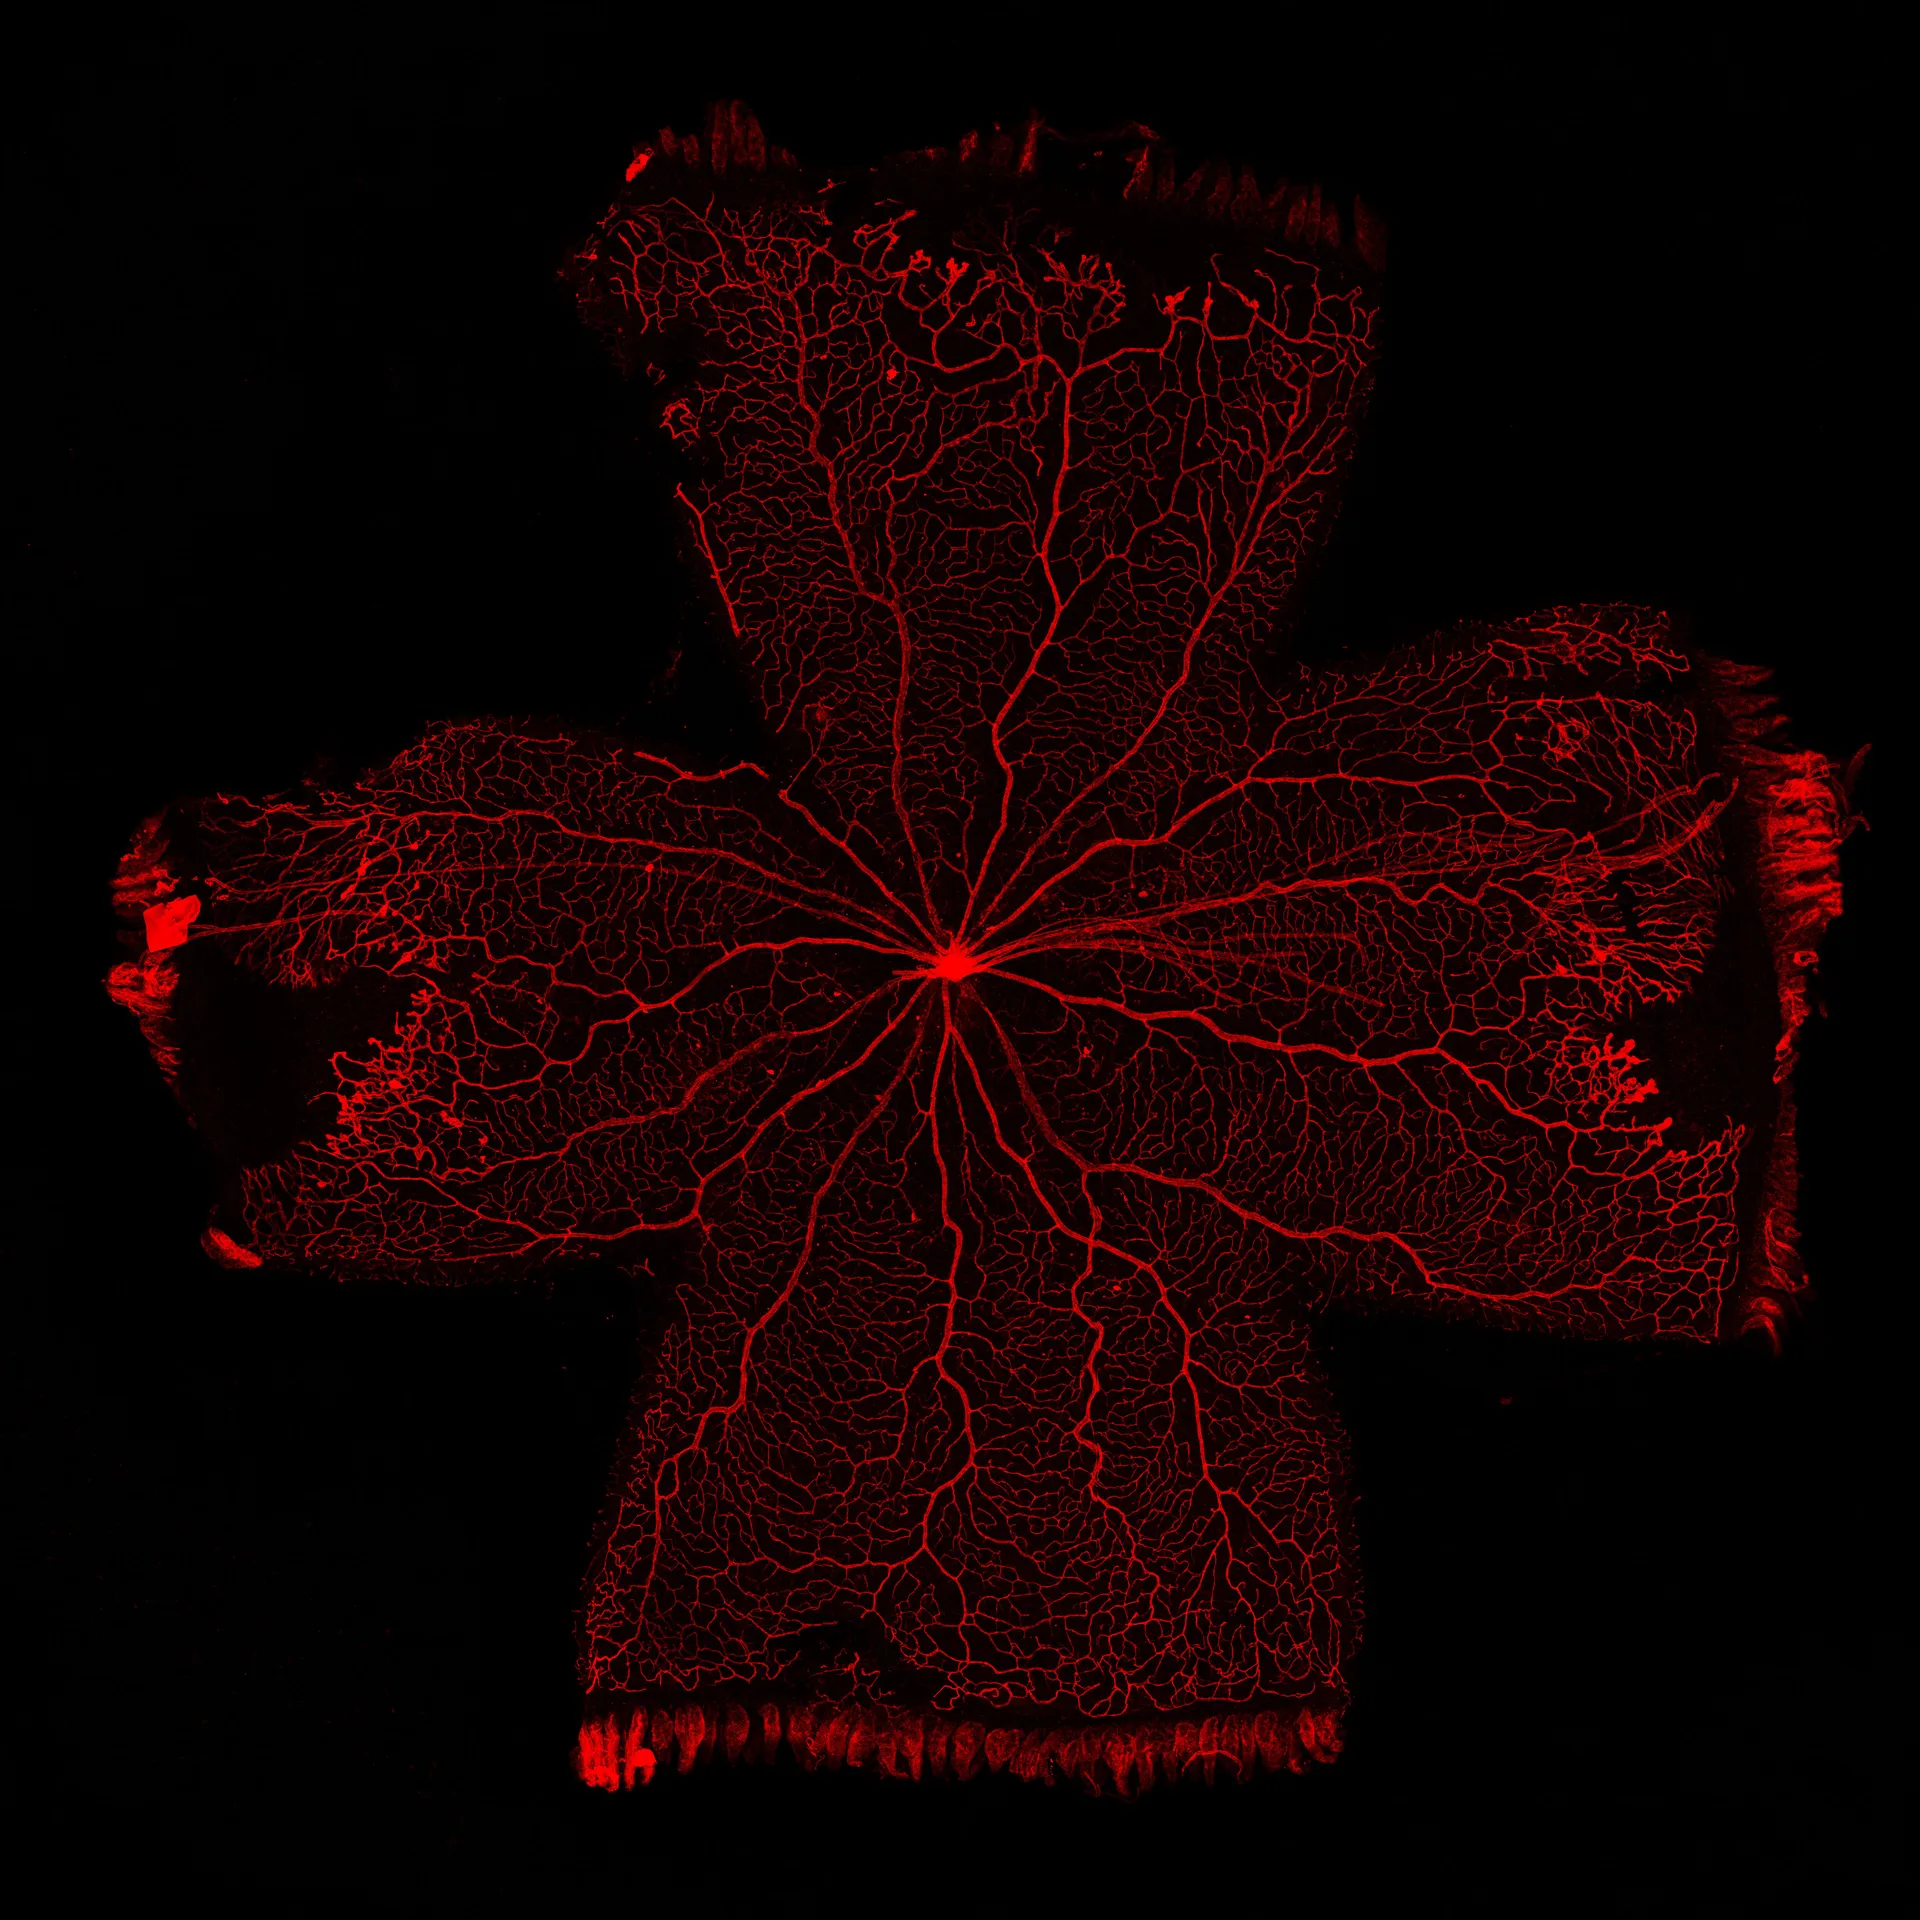
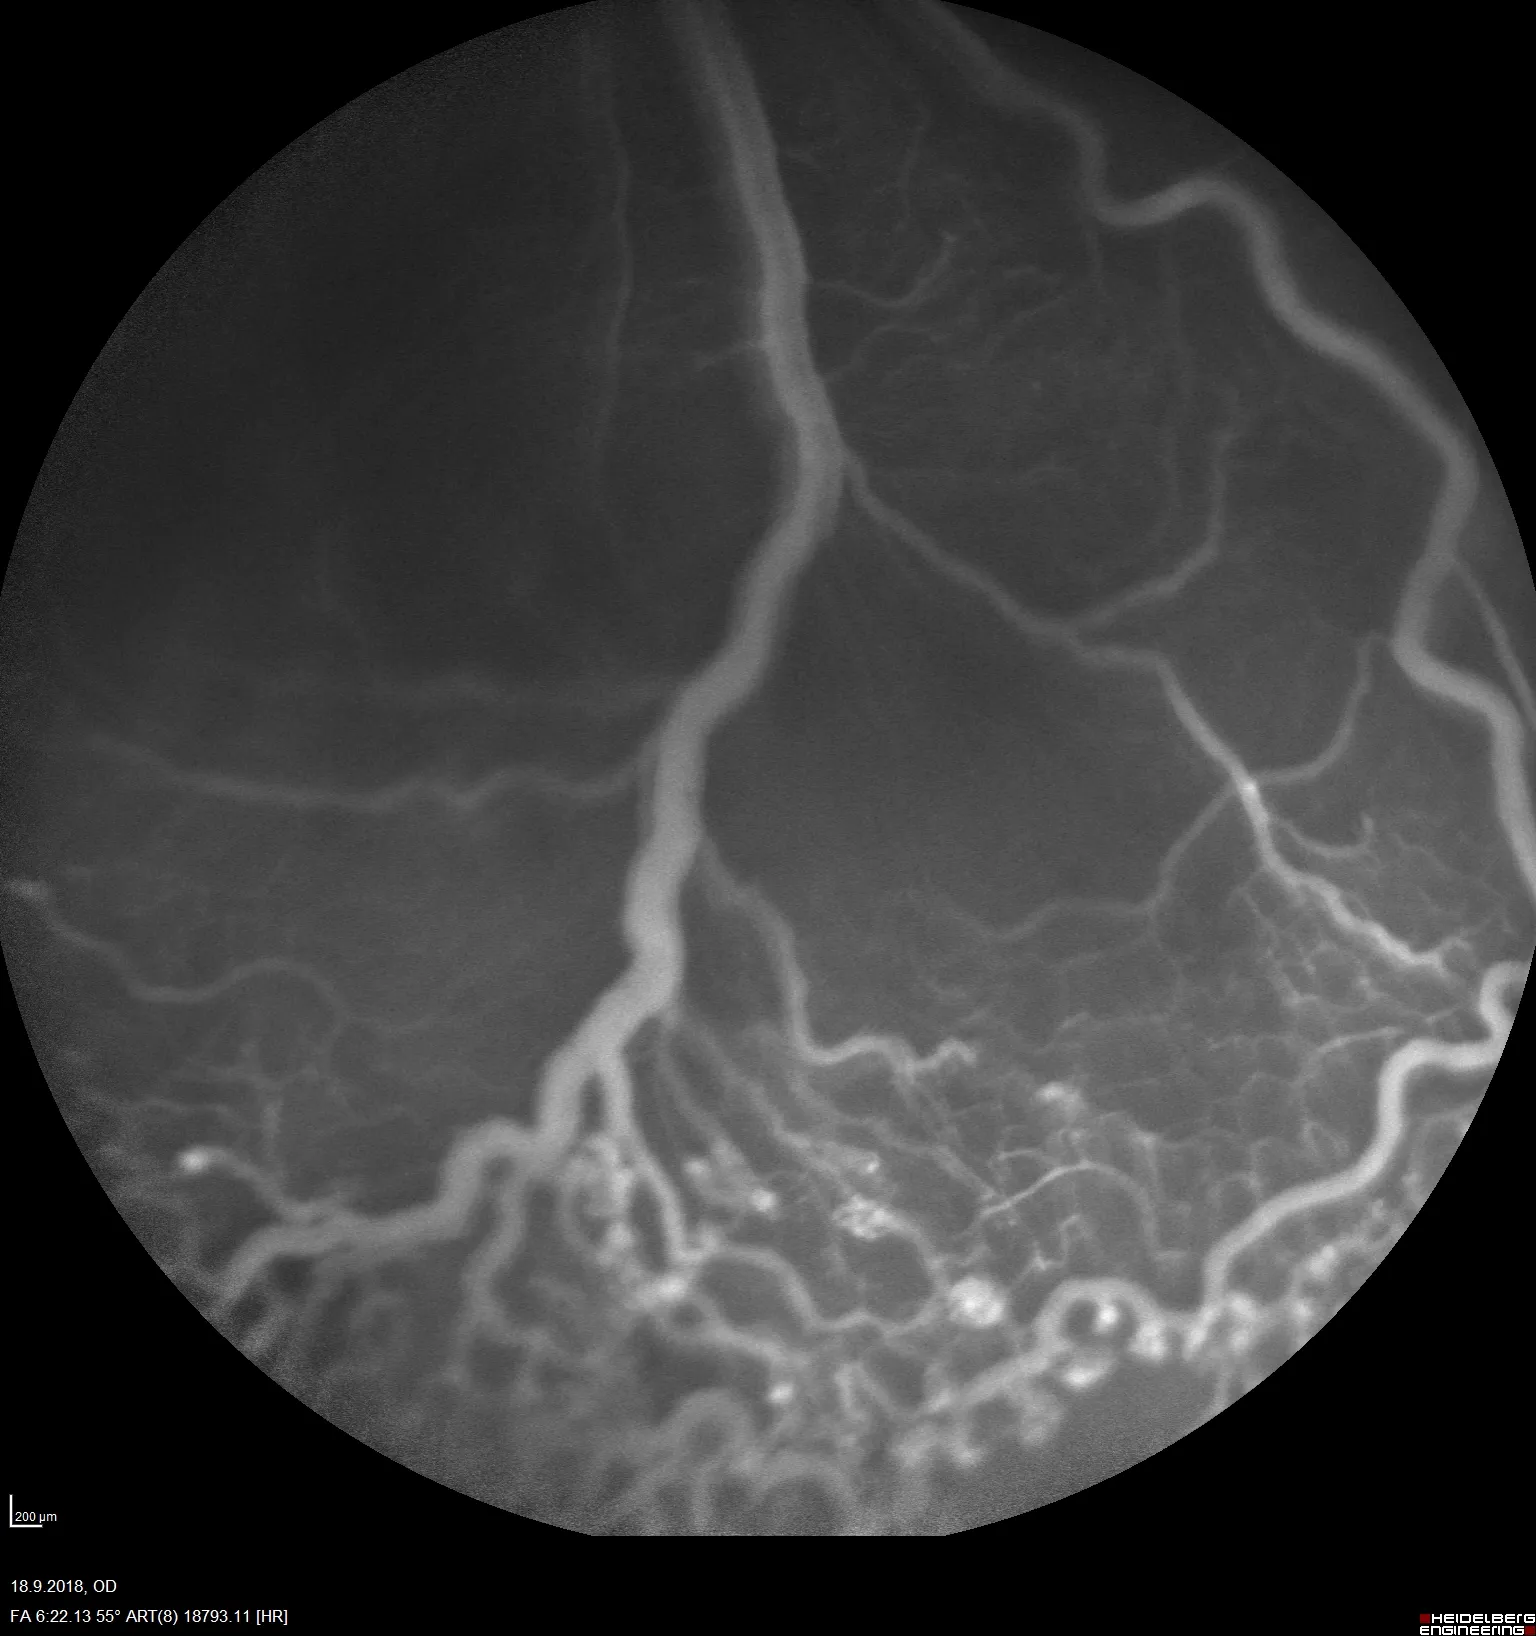
At Experimentica, we have implemented and validated both mouse and rat OIR models with a clinically relevant reference compound making them ideal for screening anti-angiogenic drug candidates. Our capabilities include morphological analysis of retinal vasculature from flat mounts, combined with in vivo imaging, such as fluorescein angiography (FA) and flash electroretinography (ERG).
Technical details
Mouse, rat
Exposure to hyperoxia (mouse) or alternating hyperoxia and hypoxia (rat) during retinal vasculature development
Induction P7-P12, tissue collection P17 (mouse)
Induction P0-P14, tissue collection P20 (rat)
Systemic, intravitreal injection
In vivo imaging (FA, rat model)
Functional assessment (ERG, rat model)
Analysis of retinal vasculature from isolectin B4 stained flat mounts:
– Avascular area/vascular obliteration
– Area of neovascularization
Scientific excellence in every model
Therapeutic testing for angiogenesis
A robust tool to screen the efficacy of anti-angiogenic test articles in the eye
Imaging & tissue-based efficacy
Non-invasive in vivo imaging techniques and high-quality tissue samples to detect efficacy
AI-driven vessel analysis
Vessel analysis utilizing cutting-edge AI technology to provide accurate and unbiased results
References
-
- Smith LE, et al., Oxygen-induced retinopathy in the mouse. Invest Ophthalmol Vis Sci, 1994. 35(1): p. 101-11.
-
- Penn, J., Henry, M. & Tolman, B. Exposure to Alternating Hypoxia and Hyperoxia Causes Severe Proliferative Retinopathy in the Newborn Rat. Pediatr Res 36, 724–731 (1994).
-
- Vähätupa M, Hakkarainen JJ, Kaja S, Uusitalo H, Järvinen TA, Uusitalo-Järvinen H, Kalesnykas G (2018) Aflibercept inhibits physiological revascularization and pathological neovascularization in the mouse and rat oxygen-induced retinopathy models. Poster presentation at EVER 2018 conference.
-
- Vähätupa M, Jääskeläinen N, Cerrada-Gimenez M, Thapa R, Järvinen T, Kalesnykas G, Uusitalo-Järvinen H. Oxygen-Induced Retinopathy Model for Ischemic Retinal Diseases in Rodents. J Vis Exp. 2020 Sep 16;(163). doi: 10.3791/61482. PMID: 33016936.
-
Access model details
Interested to learn more? Submit the form, and we will provide tailored information on this model.
"*" indicates required fields
We are here to help
Whether you have a question about our preclinical models, capabilities, pricing or anything else, our team is ready to answer all your inquiries.
Related services
Flash Electroretinography
Flash ERG is a non-invasive method to assess retinal function in preclinical eye disease models.
Learn moreOptomotor Reflex
Experimentica offers behavioral assessment and optomotor response testing to evaluate visual acuity and contrast sensitivity in rodent models.
Learn moreIn vivo imaging
Experimentica offers extensive in vivo imaging capabilities for high-resolution ocular assessments across species.
Learn moreCheck out our latest news and activities
All News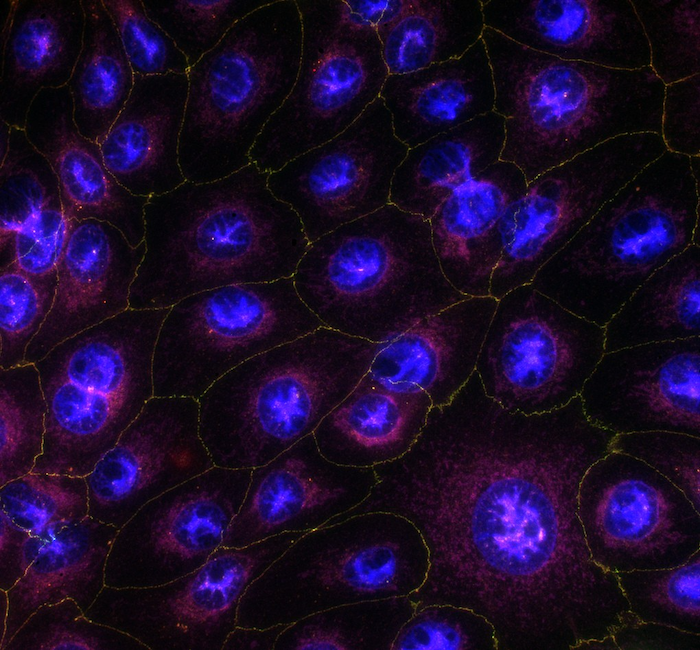
Faster results for in vitro corneal permeability studies

Experimentica Appoints Dr. Artem Shatillo as Director, Digital Transformation
FELASA 2025 presentation: Assessing lidocaine-based analgesia for mouse ear notching: Insights into strain-specific reactions